
Product Utilization Reports
Reference No: 24995 C61C524327
(V 02.00.14-00)
Table of Contents
Details
In CR2, a new feature named Utilization is added which will help you in viewing, planning and streamlining both the financial and physical utilization of stock, with a historical perspective. This can be accomplished by generating custom Product Utilization Reports from the Reports module.
Note: To use this document you need to have the Product Utilization Reports package of CR2 installed in your system in addition to CR2.
Functionality
The Utilization feature gives you a comprehensive outlook regarding the present as well as historical stock levels of your products and its utilization scenario – as to whether it was optimally utilized to generate maximum revenue possible or not. The Utilization gets calculated only for those products/assets whose invoice were generated and posted.
The constituent entities of the Utilization feature are:
Financial Utilization by Product.
Financial Utilization by Asset.
Physical Utilization by Product.
Physical Utilization by Asset.
Terminology
The various terms and terminologies used for explaining the Utilization feature are given in the table 1.0.
Table 1.0 Terminology
Term | Definition |
Product | The product/asset you have in your inventory. |
Day Price | Day Price given in the Order line level for the product with status as Out. |
Defined Day Price | Daily price defined for the product in item edit window applicable for the day. |
Week Price | Week Price given in the Order line level for the product with status as Out. |
Defined Week Price | Weekly price defined for the product in item edit window applicable for the day. |
Month Price | Month Price given in the Order line level for the product with status as Out. |
Defined Month Price | Monthly price defined for the product in item edit window applicable for the day. |
Rented Quantity | Quantity of a product that was rented out on a particular day. |
Stock Quantity | Quantity of a product that was in stock for a particular day. |
DICM | Days in the current Calendar Month. |
Daily Physical Utilization (DPU) | Physical Utilization percentage calculated for a product or asset for a day. |
| |
Terms Related to Revenue Calculations | |
Daily Revenue for the product/asset from all order item lines with Unit as Day (DRUD) | Day Price for the day x Rented Quantity for the day |
Potential Daily Revenue for the product/asset from all order item lines with Unit as Day (PDRUD) | Defined Day Price for the day x Stock Quantity for the day |
Daily Revenue for the product/asset from all order item lines with Unit as Week (DRUW) | Week Price given for Order Item line/7 x Rented Quantity for the day |
Potential Daily Revenue for the product/asset from all order item lines with Unit as Week (PDRUW) | [(Defined Week Price for the day/7) x Stock Quantity for the day] |
Daily Revenue for the product/asset from all order item lines with Unit as Month (DRUM) | [(Monthly Price given for Order Item line/DICM) x Rented Quantity for the day] |
Potential Daily Revenue for the product/asset from all order item lines with Unit as Month (PDRUM) | [(Defined Month Price for the day/DICM) x Stock Quantity for the day] |
Sum of Daily Revenues for the product/asset from All Order item Lines with unit as day, week or month (DRAOL) | DRUD + DRUW + DRUM |
Financial Utilization by Asset/Product
The Financial Utilization feature is calculated as a percentage of the actual revenue earned by the asset or products in your stock, against the potential revenue they could have earned over the same period of time.
The Financial Utilization of asset/product is calculated as:
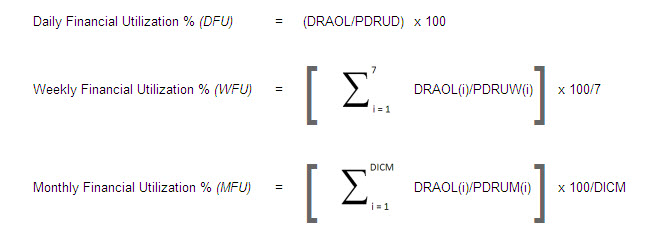
Note: The invoice line start date and end date are used for calculating the Financial Utilization.
Physical Utilization by Product
The Physical Utilization by Product feature helps you to understand the utilization scenario of your products with regards to their stock levels in the inventory. The Physical Utilization of a product is calculated as a percentage of its actual utilization versus its maximum possible utilization, for a given period of time.
The Physical Utilization of a product is calculated as:
Daily Physical Utilization percentage (DPU) = 100 x (Rented Quantity/Stock Quantity).
Weekly Physical Utilization percentage (WPU) = 100 x (Sum of Daily Physical Utilization calculated for each day of the week)/7.
Monthly Physical Utilization percentage (MPU) = 100 x (Sum of Daily Physical Utilization calculated for each day of the month)/DICM.
Physical Utilization by Asset
The Physical Utilization by Asset feature helps you to understand the utilization scenario of your product's asset. The Physical Utilization of an Asset is calculated as a percentage of its actual utilization versus its maximum possible utilization, for a given period of time.
The Physical Utilization of an Asset is calculated as:
Daily Physical Utilization percentage (DPU) | = | 100 x | (Rented Quantity/Stock Quantity) = 100% if rented out, else zero. |
|
|
|
|
Weekly Physical Utilization percentage (WPU) | = | 100 x | (Sum of Daily Physical Utilization calculated for each day of the week)/7 |
| = | 100 x | (Total number of days in the week when asset was rented out/7). |
|
|
|
|
Monthly Physical Utilization percentage (MPU) | = | 100 x | (Sum of Daily Physical Utilization calculated for each day of the month)/DICM |
| = | 100 x | (Total number of days in the month when asset was rented out/DICM). |
Database Tables for Utilization
Three new tables are created in the database for storing the data used for implementing the Utilization feature. They are:
ProductUtilization - This database table stores all the data for calculating the financial and physical utilizations of products.
AssetUtilization - This database table stores all the data for calculating the financial and physical utilizations of assets.
UtilizationTransferred - This database table is used to keep track of the Invoices/Batches from where the assets or products where used for calculating their Utilizations.
The data gets populated to these tables at midnight of every day by running a pre-scheduled procedure named GenerateProductUtilization.
If the GenerateProductUtilization procedure fails to run on a particular day, then:
The system will automatically update the database tables for utilization the next time when the pre-scheduled procedure runs (which is midnight of the next day).
Alternatively the GenerateProductUtilization procedure can be run manually, if need be. To execute the procedure manually, go to the SQL Prompt and type the command "exec GenerateProductUtilization;" and press Enter.
If financial utilization has to be calculated for such a day, then the previous day's stock (Stock Quantity) will be used to do so.
Details of Database Tables
The details of the columns within the above listed database tables are explained in the tables given below.
Table 2.0 Product Utilization Database Table's Structure (for Physical Utilization by Product and Financial Utilization by Product)
Column Name | Data Type | Functionality |
PROD_UTL_IID | NUMBER(15) | Unique key of the ProductUtilization table. |
TRANSACTIONDATE | DATE | Date of the transaction |
INVIID | NUMBER(15) | InvIID of the product |
SKU | VARCHAR2(22) | Product ID of the product |
DESCRIPTION | VARCHAR2(200) | Description of the product |
SITEIID | NUMBER(15) | SiteIID of the product |
STOCK | NUMBER(15) | The stock quantity |
POTNTL_DAY_REVENUE | NUMBER(15,6) | Potential Daily Revenue for the product from all order item lines with Unit as Day (PDRUD) |
POTNTL_WEEK_REVENUE_PERDAY | NUMBER(15,6) | Potential Daily Revenue for the product from all order item lines with Unit as Week (PDRUW) |
POTNTL_MONTH_REVENUE_PERDAY | NUMBER(15,6) | Potential Daily Revenue for the product from all order item lines with Unit as Month (PDRUM) |
UTILIZEDQTY | NUMBER(15) | The rented quantity |
ACTUAL_DAY_REVENUE | NUMBER(15,6) | Sum of Daily Revenues for the product from All Order item Lines with unit as day, week or month (DRAOL) |
SUBRENTQTY | NUMBER(15) | Quantity sub-rented per day in Rental Orders |
SUBRENTCOST | NUMBER(15,6) | Sub-rent cost, which is its amount in the Purchase Order |
SUBRENT_DAY_REVENUE | NUMBER(15,6) | Daily revenue from sub-rented products |
AVGCOST | NUMBER(15,6) | The average cost |
CATEGORY | VARCHAR2(40) | Category of the product |
SUBCATEGORY | VARCHAR2(40) | Subcategory of the product |
REPORTGRP | VARCHAR2(40) | Report Group of the product |
EXCHANGEGRP | VARCHAR2(40) | Exchange Group of the product |
DEPARTMENT | VARCHAR2(40) | Department of the product |
REMARKS | VARCHAR2(1000) | If the GenerateProductUtilization procedure failed to run on any particular day and if financial utilization has to be calculated for such a day, then remarks get inserted into this column stating that the stock was taken from the previous day (and the previous day's date will also be mentioned here). |
ACTUAL_REVENUE_UNIT_DAY | NUMBER(15,6) | Per day revenue for the product if unit is day |
ACTUAL_REVENUE_UNIT_WEEK | NUMBER(15,6) | Per day revenue for the product if unit is week |
ACTUAL_REVENUE_UNIT_MONTH | NUMBER(15,6) | Per day revenue for the product if unit is month |
NO_OF_ORDERS | NUMBER(9) | Number of orders in which the product is used for the day |
SUBRENT_REVENUE_UNIT_DAY | NUMBER(15,6) | Per day revenue for the sub-rented quantity of the product if unit is day |
SUBRENT_REVENUE_UNIT_WEEK | NUMBER(15,6) | Per day revenue for the sub-rented quantity of the product if unit is week |
SUBRENT_REVENUE_UNIT_MONTH | NUMBER(15,6) | Per day revenue for the sub-rented quantity of the product if unit is month |
Table 2.1 AssetUtilization Database Table's Structure (for Physical Utilization by Asset and Financial Utilization by Asset)
Column Name | Data Type | Functionality |
ASSET_UTL_IID | NUMBER(15) | Unique key of the AssetUtilization table |
TRANSACTIONDATE | DATE | Date of the transaction |
INVSERIID | NUMBER(15) | InvserIID of the asset |
SERIALNUM | VARCHAR2(21) | AssetID which is the serial number of the asset. |
SKU | VARCHAR2(22) | SKU of the asset's parent product |
SITEIID | NUMBER(15) | SiteIID of the asset |
POTNTL_DAY_REVENUE | NUMBER(15,6) | Potential Daily Revenue for the asset from all order item lines with Unit as Day (PDRUD) |
POTNTL_WEEK_REVENUE_PERDAY | NUMBER(15,6) | Potential Daily Revenue for the asset from all order item lines with Unit as Week (PDRUW) |
POTNTL_MONTH_REVENUE_PERDAY | NUMBER(15,6) | Potential Daily Revenue for the asset from all order item lines with Unit as Month (PDRUM) |
UTILIZEDQTY | NUMBER(15) | Rented quantity |
ACTUAL_DAY_REVENUE | NUMBER(15,6) | Sum of Daily Revenues for the asset from All Order item Lines with unit as day, week or month (DRAOL) |
AVGCOST | NUMBER(15,6) | The average cost |
CATEGORY | VARCHAR2(40) | Category of the asset's parent product |
SUBCATEGORY | VARCHAR2(40) | Subcategory of the asset's parent product |
REPORTGRP | VARCHAR2(40) | Report Group of the asset's parent product |
EXCHANGEGRP | VARCHAR2(40) | Exchange Group of the asset's parent product |
DEPARTMENT | VARCHAR2(40) | Department of the asset's parent product |
ACTUAL_REVENUE_UNIT_DAY | NUMBER(15,6) | Per day revenue for the asset if unit is day |
ACTUAL_REVENUE_UNIT_WEEK | NUMBER(15,6) | Per day revenue for the asset if unit is week |
ACTUAL_REVENUE_UNIT_MONTH | NUMBER(15,6) | Per day revenue for the asset if unit is month |
NO_OF_ORDERS | NUMBER(9) | Number of orders in which the asset's product is used for the day |
Table 2.2 Utilization Transferred Database Table's Structure
Column Name | Data Type | Functionality |
BATCHHEADIID | NUMBER(15) | Stores the BatchHeadIID of batches from where the assets or products where used for calculating their Utilizations. This is fetched from the INVOICEHEAD database table. |
INVOICEIID | NUMBER(15) | Stores the InvoiceIID of invoices from where the assets or products where used for calculating their Utilizations. This is fetched from the INVOICEHEAD database table. |
Views for Utilization
Ten new views are created for displaying the utilizations calculated using the Utilization feature. They are:
Rep_ProductUtilizationView - This view displays the utilization related information for the financial and physical utilizations of products.
Rep_Prod_Month_UtilizationView - This view displays the monthly utilization related information for the financial utilization of products.
Rep_DailyUtlbyCategoryView - This view displays the daily utilization related information for the financial utilization of products by category.
Rep_DailyUtlbySubCategoryView - This view displays the daily utilization related information for the financial utilization of products by subcategory.
Rep_DailyUtlbyReportGrpView -This view displays the daily utilization related information for the financial utilization of products by report group.
Rep_DailyUtlbyExchangegrpView - This view displays the daily utilization related information for the financial utilization of products by exchange group.
Rep_DailyUtlbyDepartmentView - This view displays the daily utilization related information for the financial utilization of products by department.
Rep_Prod_Subrent_UtlzationView - This view displays the daily utilization related information for the financial utilization of products which were sub-rented.
Rep_AssetUtilizationView - This view displays the utilization related information for the financial and physical utilizations of assets.
Rep_Asst_Month_UtilizationView - This view displays the monthly utilization related information for the financial utilization of assets.
The above mentioned views can be used to generate customized Product Utilization Reports from CR2 > Reports > File > Custom Reports.
Details of Views
The details of the fields within the above listed views are explained in the tables given below.
Table 3.0 Rep_ProductUtilizationView View's Field Structure
Column Name | Functionality |
PRODUCT_UTL_IID | The unique key of the ProductUtilization table |
TRANSACTIONDATE | Date of the transaction |
PRODUCTIID | InvIID of the product |
PRODUCTID | Product ID of the product |
DESCRIPTION | Description of the product |
SITEID | SiteID of the product |
STOCK | The stock quantity |
POTENTIAL_DAY_REVENUE | Potential Daily Revenue for the product from all order item lines with Unit as Day (PDRUD) |
POTENTIAL_WEEK_REVENUE_PERDAY | Potential Daily Revenue for the product from all order item lines with Unit as Week (PDRUW) |
POTENTIAL_MONTH_REVENUE_PERDAY | Potential Daily Revenue for the product from all order item lines with Unit as Month (PDRUM) |
UTILIZEDQTY | The rented quantity |
PER_DAY_REVENUE | Sum of Daily Revenues for the product from All Order item Lines with unit as day, week or month (DRAOL) |
SUBRENTQTY | Quantity sub-rented per day in Rental Orders |
SUBRENTCOST | Sub-rent cost, which is its amount in the Purchase Order |
SUBRENT_DAY_REVENUE | Daily revenue from sub-rented products |
AVGCOST | The average cost |
CATEGORY | Category of the product |
SUBCATEGORY | Subcategory of the product |
REPORTGRP | Report Group of the product |
EXCHANGEGRP | Exchange Group of the product |
DEPARTMENT | Department of the product |
DAILY_FINANCIAL_UTILIZATION | Daily Financial Utilization percentage of the product (DFU) |
WEEKLY_FINANCIAL_UTILIZATION | Weekly Financial Utilization percentage of the product (WFU) |
MONTHLY_FINANCIAL_UTILIZATION | Monthly Financial Utilization percentage of the product (MFU) |
DAILY_PHYSICAL_UTILIZATION | Daily Physical Utilization percentage of the product (DPU) |
ACTUAL_REVENUE_UNIT_DAY | Per day revenue for the product if unit is day |
ACTUAL_REVENUE_UNIT_WEEK | Per day revenue for the product if unit is week |
ACTUAL_REVENUE_UNIT_MONTH | Per day revenue for the product if unit is month |
NO_OF_ORDERS | Number of orders in which the product is used for the day |
SUBRENT_REVENUE_UNIT_DAY | Per day revenue for the sub-rented quantity of the product if unit is day |
SUBRENT_REVENUE_UNIT_WEEK | Per day revenue for the sub-rented quantity of the product if unit is week |
SUBRENT_REVENUE_UNIT_MONTH | Per day revenue for the sub-rented quantity of the product if unit is month |
Table 3.1 Rep_Prod_Month_UtilizationView View's Field Structure
Column Name | Functionality |
PRODUCTID | Product ID of the product |
INVIID | InvIID of the product |
DESCRIPTION | Description of the product |
CATEGORY | Category of the product |
SUBCATEGORY | Subcategory of the product |
REPORTGRP | Report Group of the product |
EXCHANGEGRP | Exchange Group of the product |
DEPARTMENT | Department of the product |
SITEID | Site ID of the product |
MONTH | Month for which MFU is calculated |
YEAR | Year for which MFU is calculated |
MFU | Monthly Financial Utilization percentage of the product |
MPU | Monthly Physical Utilization percentage of the product |
LASTDAY_RENTEDQTY | Quantity of the item which is invoiced and posted on the last day of the calendar month. |
LASTDAY_STOCKQTY | Total stock of the Item on the last day of the calendar month. |
Table 3.2 Rep_DailyUtlbyCategoryView View's Field Structure
Column Name | Functionality |
TRANSACTIONDATE | Date of the transaction |
CATEGORY | Category of the product |
DESCRIPTION | Description of the product |
SITEID | Site ID of the product |
POTENTIAL_DAY_REVENUE | Potential Daily Revenue for the product from all order item lines with Unit as Day (PDRUD) |
POTENTIAL_WEEK_REVENUE_PERDAY | Potential Daily Revenue for the product from all order item lines with Unit as Week (PDRUW) |
POTENTIAL_MONTH_REVENUE_PERDAY | Potential Daily Revenue for the product from all order item lines with Unit as Month (PDRUM) |
ACTUAL_DAY_REVENUE | Sum of Daily Revenues for the asset from All Order item Lines with unit as day, week or month (DRAOL) |
FIN_UTL_DAY_PERCENTAGE | Daily Financial Utilization percentage of the product (DFU) |
FIN_UTL_DAY_PERCENTAGE_UD | Daily Financial Utilization percentage of the product if unit is day |
FIN_UTL_DAY_PERCENTAGE_UW | Daily Financial Utilization percentage of the product if unit is week |
FIN_UTL_DAY_PERCENTAGE_UM | Daily Financial Utilization percentage of the product if unit is month |
NO_OF_ORDERS | Number of orders in which the product is used for the day |
Table 3.3 Rep_DailyUtlbySubCategoryView View's Field Structure
Column Name | Functionality |
TRANSACTIONDATE | Date of the transaction |
SUBCATEGORY | Subcategory of the product |
DESCRIPTION | Description of the product |
SITEID | Site ID of the product |
POTENTIAL_DAY_REVENUE | Potential Daily Revenue for the product from all order item lines with Unit as Day (PDRUD) |
POTENTIAL_WEEK_REVENUE_PERDAY | Potential Daily Revenue for the product from all order item lines with Unit as Week (PDRUW) |
POTENTIAL_MONTH_REVENUE_PERDAY | Potential Daily Revenue for the product from all order item lines with Unit as Month (PDRUM) |
ACTUAL_DAY_REVENUE | Sum of Daily Revenues for the asset from All Order item Lines with unit as day, week or month (DRAOL) |
FIN_UTL_DAY_PERCENTAGE | Daily Financial Utilization percentage of the product (DFU) |
FIN_UTL_DAY_PERCENTAGE_UD | Daily Financial Utilization percentage of the product if unit is day |
FIN_UTL_DAY_PERCENTAGE_UW | Daily Financial Utilization percentage of the product if unit is week |
FIN_UTL_DAY_PERCENTAGE_UM | Daily Financial Utilization percentage of the product if unit is month |
NO_OF_ORDERS | Number of orders in which the product is used for the day |
Table 3.4 Rep_DailyUtlbyReportGrpView View's Field Structure
Column Name | Functionality |
TRANSACTIONDATE | Date of the transaction |
REPORTGRP | Report Group of the product |
DESCRIPTION | Description of the product |
SITEID | Site ID of the product |
POTENTIAL_DAY_REVENUE | Potential Daily Revenue for the product from all order item lines with Unit as Day (PDRUD) |
POTENTIAL_WEEK_REVENUE_PERDAY | Potential Daily Revenue for the product from all order item lines with Unit as Week (PDRUW) |
POTENTIAL_MONTH_REVENUE_PERDAY | Potential Daily Revenue for the product from all order item lines with Unit as Month (PDRUM) |
ACTUAL_DAY_REVENUE | Sum of Daily Revenues for the asset from All Order item Lines with unit as day, week or month (DRAOL) |
FIN_UTL_DAY_PERCENTAGE | Daily Financial Utilization percentage of the product (DFU) |
FIN_UTL_DAY_PERCENTAGE_UD | Daily Financial Utilization percentage of the product if unit is day |
FIN_UTL_DAY_PERCENTAGE_UW | Daily Financial Utilization percentage of the product if unit is week |
FIN_UTL_DAY_PERCENTAGE_UM | Daily Financial Utilization percentage of the product if unit is month |
NO_OF_ORDERS | Number of orders in which the product is used for the day |
Table 3.5 Rep_DailyUtlbyExchangegrpView View's Field Structure
Column Name | Functionality |
TRANSACTIONDATE | Date of the transaction |
EXCHANGEGRP | Exchange Group of the product |
DESCRIPTION | Description of the product |
SITEID | Site ID of the product |
POTENTIAL_DAY_REVENUE | Potential Daily Revenue for the product from all order item lines with Unit as Day (PDRUD) |
POTENTIAL_WEEK_REVENUE_PERDAY | Potential Daily Revenue for the product from all order item lines with Unit as Week (PDRUW) |
POTENTIAL_MONTH_REVENUE_PERDAY | Potential Daily Revenue for the product from all order item lines with Unit as Month (PDRUM) |
ACTUAL_DAY_REVENUE | Sum of Daily Revenues for the asset from All Order item Lines with unit as day, week or month (DRAOL) |
FIN_UTL_DAY_PERCENTAGE | Daily Financial Utilization percentage of the product (DFU) |
FIN_UTL_DAY_PERCENTAGE_UD | Daily Financial Utilization percentage of the product if unit is day |
FIN_UTL_DAY_PERCENTAGE_UW | Daily Financial Utilization percentage of the product if unit is week |
FIN_UTL_DAY_PERCENTAGE_UM | Daily Financial Utilization percentage of the product if unit is month |
NO_OF_ORDERS | Number of orders in which the product is used for the day |
Table 3.6 Rep_DailyUtlbyDepartmentView View's Field Structure
Column Name | Functionality |
TRANSACTIONDATE | Date of the transaction |
DEPARTMENT | Department of the product |
DESCRIPTION | Description of the product |
SITEID | Site ID of the product |
POTENTIAL_DAY_REVENUE | Potential Daily Revenue for the product from all order item lines with Unit as Day (PDRUD) |
POTENTIAL_WEEK_REVENUE_PERDAY | Potential Daily Revenue for the product from all order item lines with Unit as Week (PDRUW) |
POTENTIAL_MONTH_REVENUE_PERDAY | Potential Daily Revenue for the product from all order item lines with Unit as Month (PDRUM) |
ACTUAL_DAY_REVENUE | Sum of Daily Revenues for the asset from All Order item Lines with unit as day, week or month (DRAOL) |
FIN_UTL_DAY_PERCENTAGE | Daily Financial Utilization percentage of the product (DFU) |
FIN_UTL_DAY_PERCENTAGE_UD | Daily Financial Utilization percentage of the product if unit is day |
FIN_UTL_DAY_PERCENTAGE_UW | Daily Financial Utilization percentage of the product if unit is week |
FIN_UTL_DAY_PERCENTAGE_UM | Daily Financial Utilization percentage of the product if unit is month |
NO_OF_ORDERS | Number of orders in which the product is used for the day |
Table 3.7 Rep_Prod_Subrent_UtlzationView View's Field Structure
Column Name | Functionality |
PRODUCT_UTL_IID | Unique key of the ProductUtilization table |
TRANSACTIONDATE | Date of the transaction |
PRODUCTIID | InvIID of the product |
PRODUCTID | Product ID of the product |
DESCRIPTION | Description of the product |
SITEID | Site ID of the product |
STOCK | The stock quantity |
POTENTIAL_DAY_REVENUE | Potential Daily Revenue for the product from all order item lines with Unit as Day (PDRUD) |
POTENTIAL_WEEK_REVENUE_PERDAY | Potential Daily Revenue for the product from all order item lines with Unit as Week (PDRUW) |
POTENTIAL_MONTH_REVENUE_PERDAY | Potential Daily Revenue for the product from all order item lines with Unit as Month (PDRUM) |
SUBRENTQTY | Quantity sub-rented in Rental Orders for the day |
SUBRENTCOST | Price incurred for sub-renting the product for the day |
SUBRENT_DAY_REVENUE | Actual Revenue generated by utilizing the sub-rented product for the day |
AVGCOST | The average cost of the Product |
CATEGORY | Category of the Product |
SUBCATEGORY | Subcategory of the Product |
REPORTGRP | Report Group of the Product |
EXCHANGEGRP | Exchange Group of the Product |
DEPARTMENT | Department of the Product |
DAILY_SUBRENT_FIN_UTIL | Daily Financial Utilization percentage calculated for the quantity of the product that was sub-rented |
WEEKLY_SUBRENT_FIN_UTIL | Weekly Financial Utilization percentage calculated for the quantity of the product that was sub-rented |
MONTH_SUBRENT_FIN_UTIL | Monthly Financial Utilization percentage calculated for the quantity of the product that was sub-rented |
NO_OF_ORDERS | Number of orders in which the product is used for the day |
DAILY_SUBRENT_FIN_UTIL_UD | Actual revenue generated for the day out of the sub-rented quantity of the product, with unit as day |
DAILY_SUBRENT_FIN_UTIL_UW | Actual revenue generated for the day out of the sub-rented quantity of the product, with unit as week |
DAILY_SUBRENT_FIN_UTIL_UM | Actual revenue generated for the day out of the sub-rented quantity of the product, with unit as month |
Table 3.8 Rep_AssetUtilizationView View's Field Structure
Column Name | Functionality |
ASSET_UTL_IID | Unique key of the AssetUtilization table |
TRANSACTIONDATE | Date of the transaction |
ASSETIID | InvserIID of the Asset |
ASSETID | AssetID which is the serial number of the asset. |
PRODUCTID | SKU of the asset's parent product |
SITEID | SiteID of the asset |
POTENTIAL_DAY_REVENUE | Potential Daily Revenue for the asset from all order item lines with Unit as Day (PDRUD) |
POTENTIAL_WEEK_REVENUE_PERDAY | Potential Daily Revenue for the asset from all order item lines with Unit as Week (PDRUW) |
POTENTIAL_MONTH_REVENUE_PERDAY | Potential Daily Revenue for the asset from all order item lines with Unit as Month (PDRUM) |
UTILIZEDQTY | The rented quantity |
ACTUAL_DAY_REVENUE | Sum of Daily Revenues for the asset from All Order item Lines with unit as day, week or month (DRAOL) |
AVGCOST | The average cost |
CATEGORY | Category of the asset's parent product |
SUBCATEGORY | Subcategory of the asset's parent product |
REPORTGRP | Report Group of the asset's parent product |
EXCHANGEGRP | Exchange Group of the asset's parent product |
DEPARTMENT | Department of the asset's parent product |
DAILY_FINANCIAL_UTILIZATION | Daily Financial Utilization percentage of the asset (DFU) |
WEEKLY_FINANCIAL_UTILIZATION | Weekly Financial Utilization percentage of the asset (WFU) |
MONTHLY_FINANCIAL_UTILIZATION | Monthly Financial Utilization percentage of the asset (MFU) |
DAILY_PHYSICAL_UTILIZATION | Daily Physical Utilization percentage of the asset (DPU) |
ACTUAL_REVENUE_UNIT_DAY | Per day revenue for the asset if unit is day |
ACTUAL_REVENUE_UNIT_WEEK | Per day revenue for the asset if unit is week |
ACTUAL_REVENUE_UNIT_MONTH | Per day revenue for the asset if unit is month |
NO_OF_ORDERS | Number of orders in which the asset's product is used for the day |
Table 3.9 Rep_Asst_Month_UtilizationView View's Field Structure
Column Name | Functionality |
PRODUCTID | Product ID of the asset's parent product |
ASSETIID | InvserIID of the Asset |
ASSETID | AssetID which is the serial number of the asset. |
CATEGORY | Category of the asset's parent product |
SUBCATEGORY | Subcategory of the asset's parent product |
REPORTGRP | Report Group of the asset's parent product |
EXCHANGEGRP | Exchange Group of the asset's parent product |
DEPARTMENT | Department of the asset's parent product |
SITEID | Site ID of the asset |
MONTH | Month for which MFU is calculated |
YEAR | Year for which MFU is calculated |
MFU | Monthly Financial Utilization percentage of the asset |
MPU | Monthly Physical Utilization percentage of the asset |
Sample Scenarios
Given below are some sample scenarios.
Sample Scenario Illustrating How RentedQty and StockQty Columns Get Populated When Report is Generated
The data gets populated in the system at midnight of every day by running a pre-scheduled procedure named GenerateProductUtilization. Consider that the stock levels of a particular Item [Item-A] and its corresponding rental quantities for the months of March, April and May 2012 are as shown in Table 4.0.
Table 4.0 Stock and Rental Quantities of Item-A
Date | Stock Quantity of the Item | Rented Quantity of the Item which is Invoiced and Posted |
March 15, 2012 | 10 | 1 |
March 31, 2012 | 10 | 2 |
April 15, 2012 | 10 | 3 |
April 30, 2012 | 20 | 5 |
May 15, 2012 | 30 | 10 |
May 31, 2012 | Invoice not yet posted for May 31st. | Invoice not yet posted for May 31st. |
If report is generated using the Rep_Prod_Month_UtilizationView for Item-A then the report will have three entries within it, one for each of the calendar months. The values for the LASTDAY_RENTEDQTY and LASTDAY_STOCKQTY columns will be as shown in Table 4.1.
Table 4.1 Report for Item-A
Entry for the month of | Stock Quantity of the Item | Rented Quantity of the Item |
March | 10 | 2 |
April | 20 | 5 |
May | 0 (Because Invoice is not yet posted for May 31st.) | 0 (Because Invoice is not yet posted for May 31st.) |